Blog
Metrics that motivate
Guides on data storytelling, visual metaphors and making numbers visible to the whole team.

Metafor
Introducing Metafor: every building a customer, every skyline a story
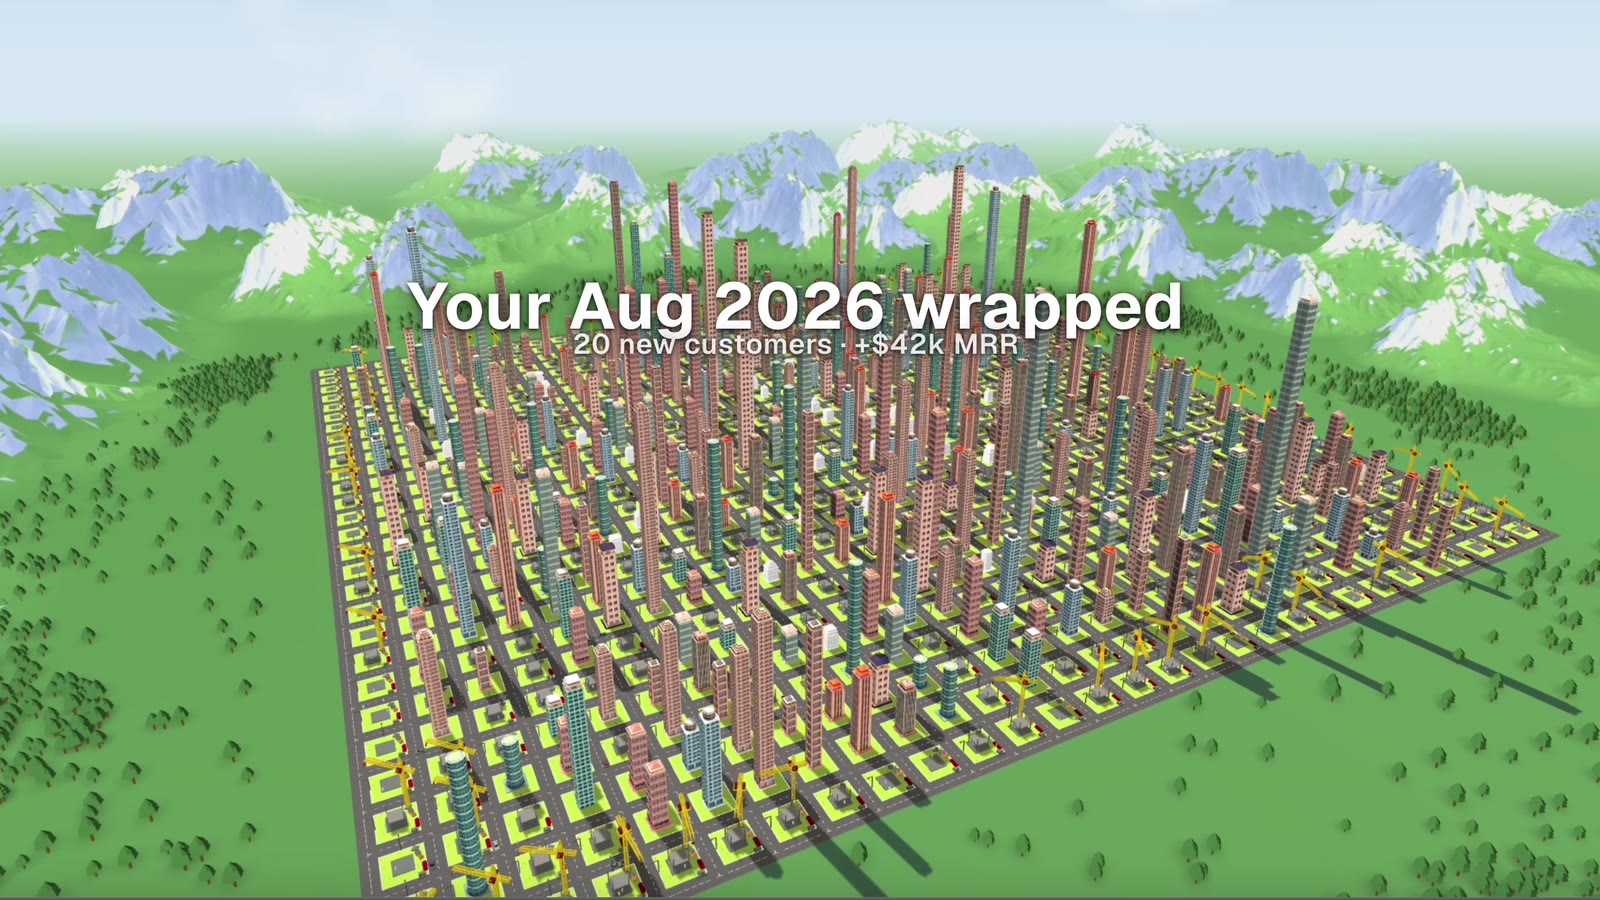
Every building a customer, every skyline a story. Metafor turns abstract customer data into an interactive story you can tell your whole team. Here's what it is, who it's for and how to get early access.
4 min read →
data storytelling
What is data storytelling? A practical guide for revenue teams
Data storytelling turns numbers into something a team can follow, remember and act on. Here is what it means, why it matters for SaaS revenue teams, and how to start.
7 min read →

dashboards
Why dashboards don't motivate teams (and what does)
BI dashboards are built to report facts, not to tell the story behind them. Here is what's missing, and what actually connects a team to the numbers.
6 min read →

visual metaphors
Visual metaphors for business data: why a city beats a spreadsheet
A visual metaphor maps abstract numbers onto something people already understand. Here is how metaphors work, how to choose a good one, and why they make data stick.
7 min read →

3D data visualization
3D data visualization: when a third dimension helps, and when it doesn't
3D charts have a bad reputation, often for good reason. But 3D worlds are a different thing. Here is when 3D data visualization adds real value, and when to stay flat.
7 min read →

KPIs
How to make KPIs visible to the whole team: a playbook for RevOps and CS
Your team can't rally around numbers they never see. A practical playbook for RevOps and Customer Success leaders who want KPIs understood across the company.
8 min read →