Introducing Metafor: every building a customer, every skyline a story
Every building a customer, every skyline a story. Metafor turns abstract customer data into an interactive story you can tell your whole team. Here's what it is, who it's for and how to get early access.
· 4 min read · The Metafor team
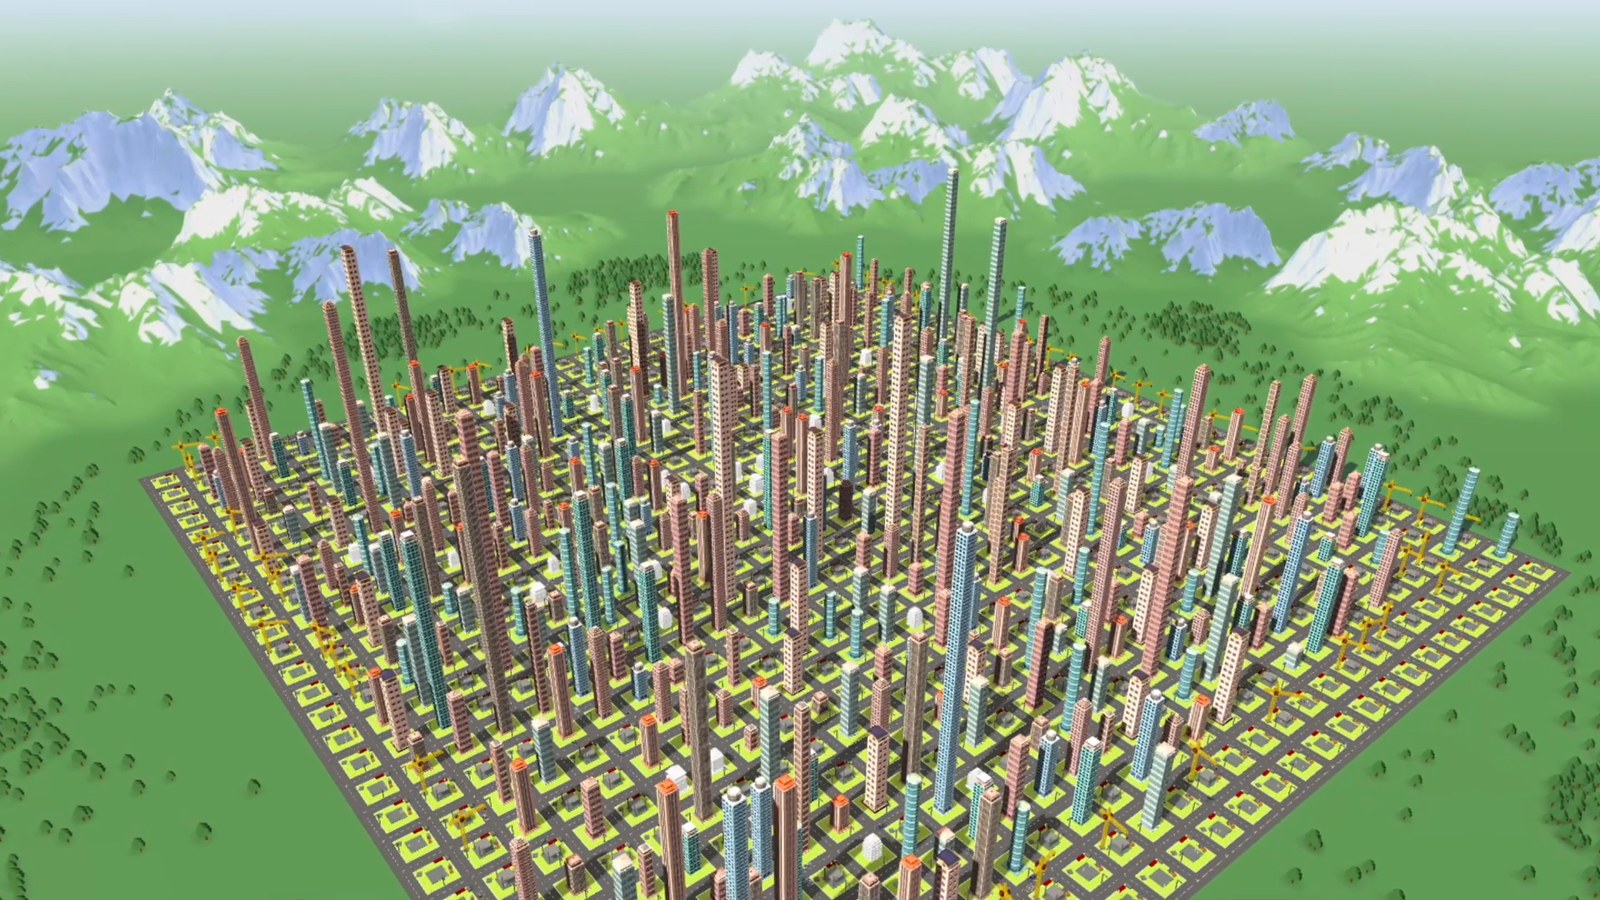
What if your data could tell you the story of your company?
That question is the reason Metafor exists. Today we’re sharing what we’ve been building: a new way for revenue teams to see their business, and to care about it.
Facts without a story
Every SaaS company has dashboards. They are precise, refreshed in real time and built for the people who analyze the business: analysts, finance, controllers. For them, a dashboard is exactly the right tool.
For everyone else, a dashboard shows the facts but not the story. The account executive, the CSM, the new developer and the team at the all-hands can see the numbers, but not how they connect to where the company is going. The data isn’t wrong. It’s just abstract, and it’s hard to rally around facts without a narrative.
That gap, between data you can analyze and a story your team can see, is what Metafor is built to close.
What Metafor is
Metafor turns abstract customer data into an interactive story you can tell your whole team. Every building a customer, every skyline a story. It connects to your customer data and renders it as an interactive 3D city.
- Every building is a customer. Your customer base becomes a skyline you can fly over, walk through and explore.
- Deals in progress are construction sites. You can see the pipeline taking shape before it becomes revenue.
- Districts are segments. Group the city by country, industry, account owner or sales lead, and see at a glance where your revenue lives.
- Time is a timeline. Drag it and the city rebuilds itself, month by month, from the first customer to today.

Wraps: the story of any period, as a short film
Some of the best moments in a company are the ones nobody sees. A new customer lands on a Tuesday afternoon and is forgotten by Friday.
Pick a week, a month, a quarter or a year, and Metafor tells its story as a short film we call a Wrap. A Wrap is more than a replay of the city: it shows the charts, the top lists and the highlights, and tells the story of the period, much like Spotify Wrapped. New customers rise as new buildings while the whole team watches the skyline grow. Share Wraps in Slack or Teams, run them on the office TV, or open the all-hands with one.
Same data, told as a story
Metafor doesn’t replace your standard KPI reporting. It runs on the same data: MRR, customers, retention and pipeline are still one click away when you need them. The difference is the job:
| Standard KPI reporting | Metafor | |
|---|---|---|
| Shows | What the numbers are | How the numbers tie into your goals and vision |
| Made to | Analyze and report | Tell a data-driven story |
| Feels | Tables, tiles and charts | Immersive, playful, a story you can see |
Built from the data you already have
Metafor connects to CRMs such as HubSpot and Planhat, CPQ tools such as Younium, or any app through MCP. There is no new data to collect. It’s the same customers and the same numbers, told as a story your whole team can see.
Who it’s for
Metafor is built for revenue-focused SaaS companies that believe every number has a story. If you lead RevOps, customer success or a revenue team, and you spend too much time trying to make the numbers land with everyone else, it was made with you in mind.
Build it with us
We’re opening Metafor to a small group of founding customers. Founding customers get early access, and what they need to see shapes what we build next.
If that sounds like your team, join the waitlist. We’ll be in touch.
All images show the Metafor product with sample data.