How to make KPIs visible to the whole team: a playbook for RevOps and CS
Your team can't rally around numbers they never see. A practical playbook for RevOps and Customer Success leaders who want KPIs understood across the company.
· 8 min read · The Metafor team

RevOps and Customer Success leaders sit on the best data in the company. You know which customers are growing, which ones are quietly at risk and where the next quarter’s revenue will come from. The hard part is getting everyone else to see it, too.
This playbook is about that hard part: making KPIs visible, understood and acted on beyond the people who build the reports.
Step 1: Pick fewer KPIs
Visibility starts with focus. If you show twenty metrics, people remember none.
Pick three to five KPIs the whole company should know. For most revenue-focused SaaS teams, a good starting set is:
- MRR or ARR, and its change since last period
- New customers won
- Net revenue retention, or expansion and churn shown separately
- At-risk customers, by count or by revenue
- One leading indicator, such as qualified pipeline or product activation
Everything else can stay in the dashboard for the people who need it.
Step 2: Show customers, not just totals
Totals hide the story. “New MRR: +€18k” is a number. “We welcomed 12 new customers this month, including our first three in Spain” is news.
Wherever you can, break KPIs down into the customers behind them. People relate to accounts with names far more than to sums. It also makes recognition natural: every new logo has a person who closed it, and every saved account has a CSM who saved it.
Step 3: Show change over time
A single number has no meaning without a reference point. Always show where we were next to where we are.
Good options:
- Compare to the previous month and the same month last year.
- Show the trend as a line or, better, as something that grows.
- Replay the period: start at the beginning and let the audience watch it unfold.
Step 4: Make health visible
Customer health is where CS adds the most value, and where visibility matters most. A churn risk that only CS knows about is a churn risk the rest of the company can’t help with.
Make at-risk accounts visible in the same picture as growth. When sales, product and leadership can see which customers need attention, they can act on it: an exec sponsor call, a product fix, a check-in from the account owner.
Equally, make high-value, healthy customers visible. They are your references, your expansion opportunities and your proof that the product works.
Step 5: Put it where people already are
Visibility fails when it requires a login. Put the picture where the team already spends time:
- Slack or Teams: a short recap at the end of each month
- The office TV: something worth looking at while waiting for coffee
- All-hands: two minutes on what the team built, before the slides
- Onboarding: show new hires the state of the business in their first week
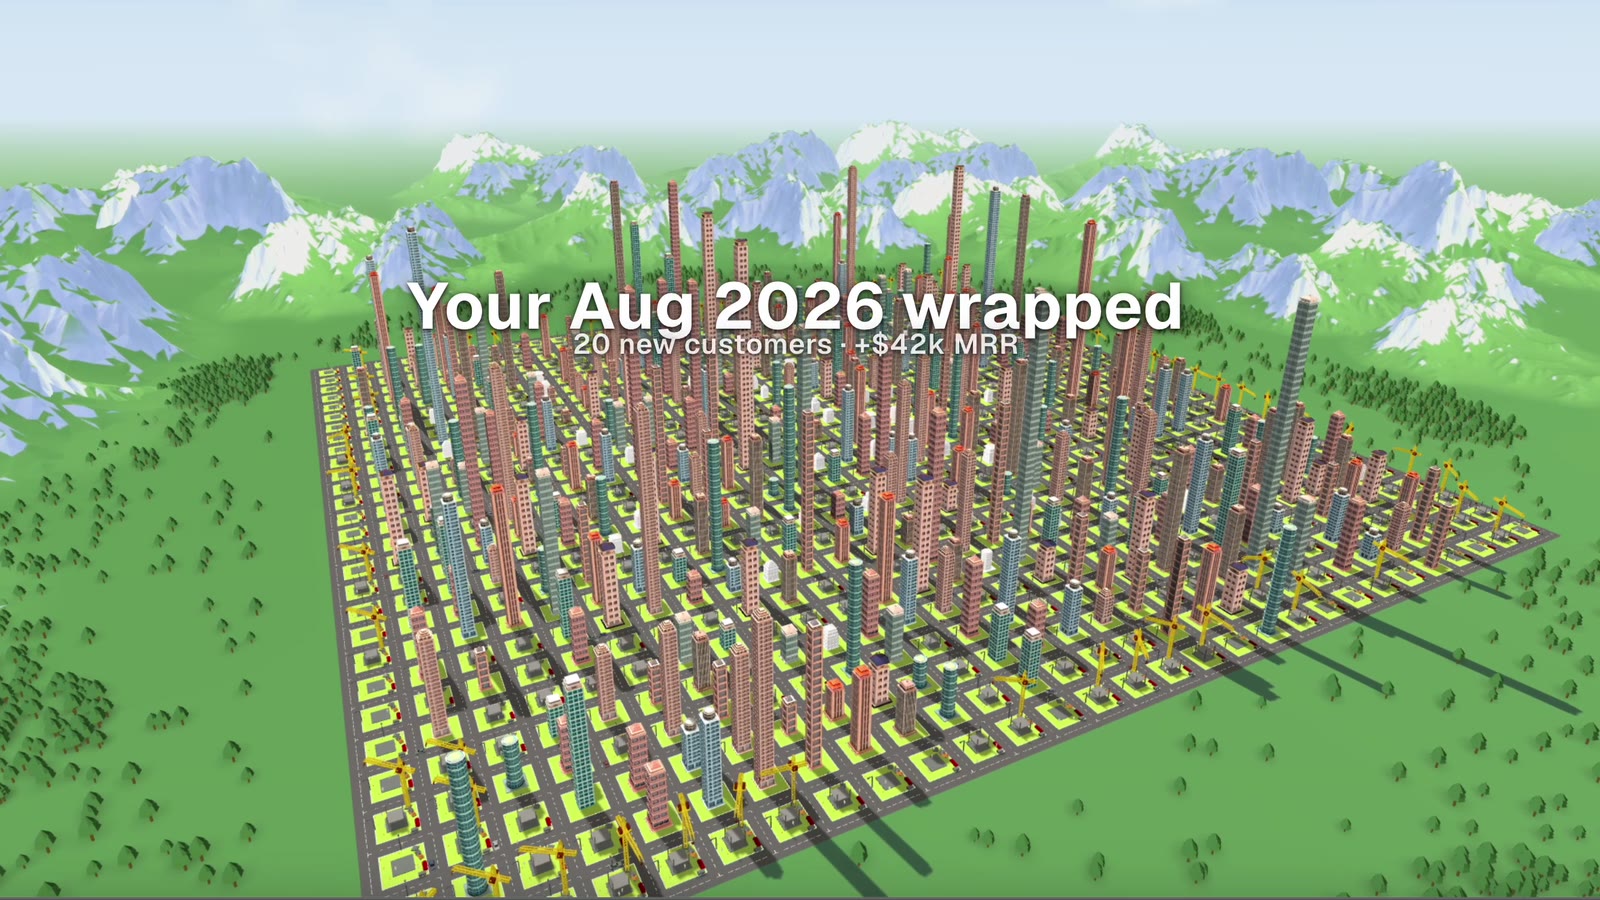 A monthly Wrap: the kind of recap a team looks forward to. Metafor product footage, sample data.
Step 6: Build a ritual
One great recap is nice. A recap every month, in the same format, is a habit. Rituals create anticipation, shared language and a reason to come back.
A simple monthly ritual:
- Context: where we started the month
- Wins: new customers and expansions, with names and owners
- Watch-outs: accounts that need help, and what we’re doing
- Trend: how this month changed the bigger picture
- Thanks: who made it happen
Step 7: Make it a picture
The final step is the one most teams skip: making KPIs visual in a way that non-analysts enjoy. Tables and standard charts are right for the people who build them. For everyone else, a visual metaphor works far better.
Think of a city where every customer is a building. Growth means a rising skyline. New customers appear as construction sites. At-risk accounts stand out. The whole company can understand the state of the business in one look, and want to look again next month.
Where Metafor fits
That’s the job we’re building Metafor for. It connects to HubSpot, Excel or Google Sheets (or any app via Zapier) and renders your customers as an interactive 3D city. You can play the timeline to watch the city grow, split it into districts by country, industry, account owner or sales lead, and point at any building to see the customer’s status, MRR and owner. Wraps turn a month or a quarter into a short film you can share in Slack or Teams, on the office TV or at the all-hands.
Checklist
- Three to five company-wide KPIs chosen
- KPIs broken down to named customers
- Every number shown with a comparison
- At-risk and high-value customers visible to everyone
- Recap delivered in Slack/Teams, TV and all-hands
- A monthly ritual on the calendar
- A visual the whole team actually wants to look at
We’re opening Metafor to a small group of founding customers. Join the waitlist for early access.